
AI Simulates the Future — Daily AI Idea: open-source MiroFish
Learn the practical workflow for using the open-source MiroFish engine: prepare news/policy/financial/fiction inputs, start the sandbox simulation, inspect key factors and confidence, generate optimistic/neutral/pessimistic/black-swan scenario branches and review decision-path recommendations. Guidance covers what to check in the repo (dependencies, model backends, input formats) before running simulations.
Image Analysis
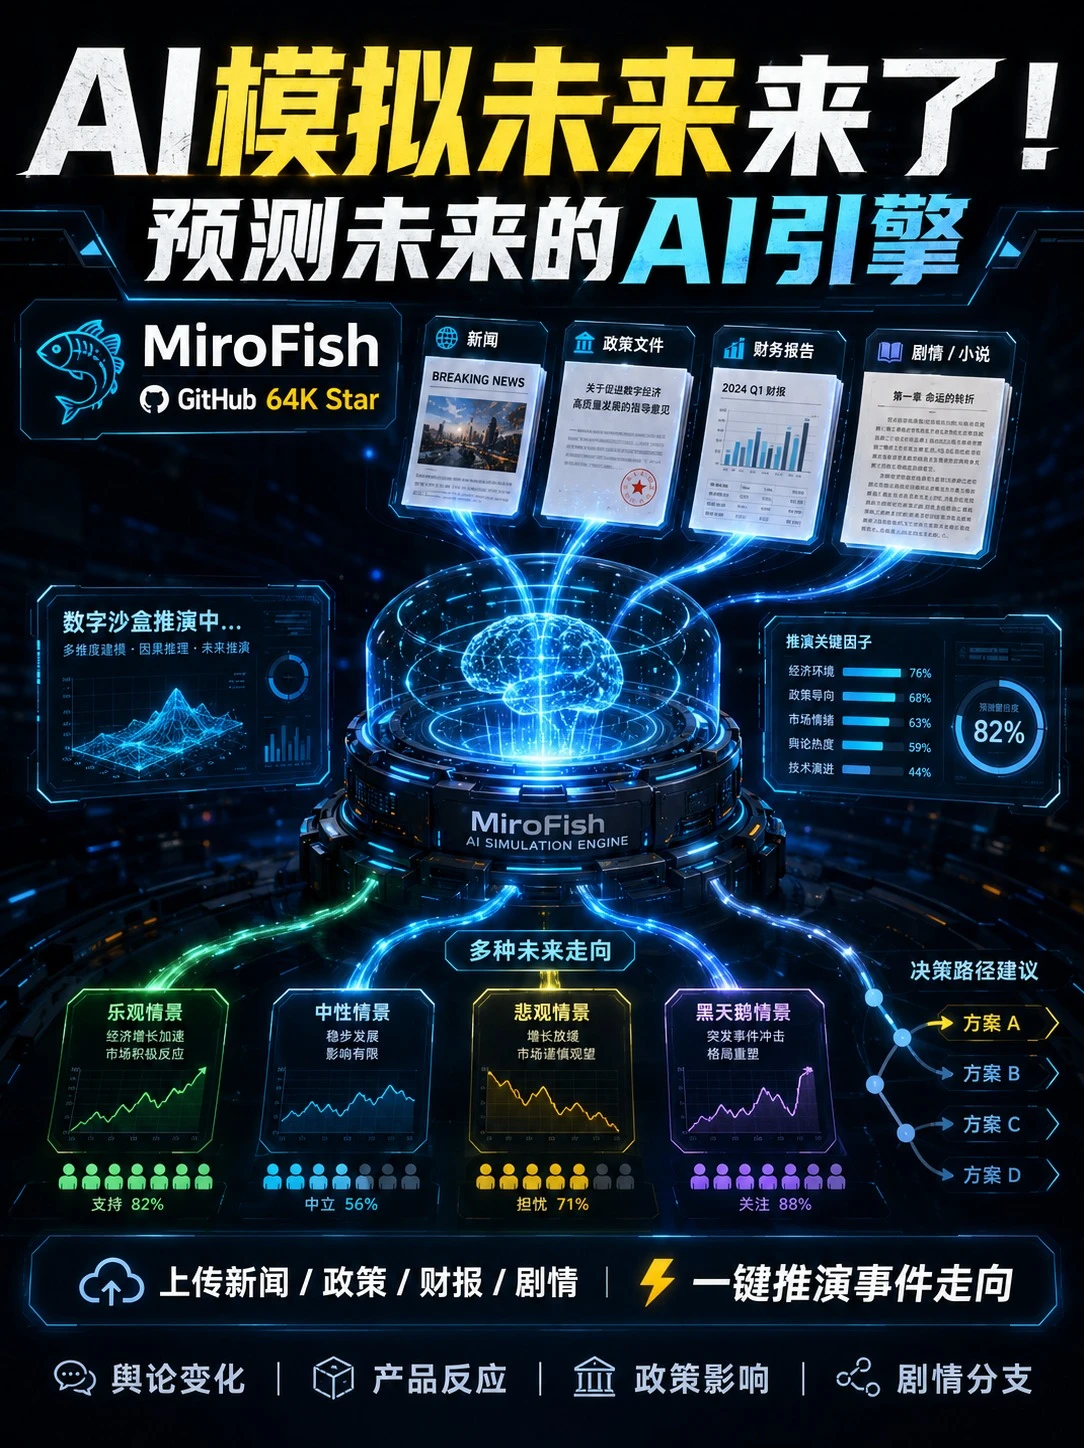
The following is a visual-evidence summary for image #1, categorized as “Facts / Unreadable / Inferred.” It lists visible text, interface steps, chart data and observable elements (only items directly visible in the image), then lists unreadable or uncertain parts, and finally reasonable inferences based on layout (marked as inferences).
1. Facts (directly visible/readable/identifiable in the image)
- Top main headings:
- “AI模拟未来来了!”
- “预测未来的AI引擎”
- Top-left branding/mark:
- “MiroFish” (fish-shaped logo)
- “GitHub 64K Star” (GitHub icon + “64K Star”)
- Central device text:
- “MiroFish”
- Small English below: “AI SIMULATION ENGINE”
- Four cards across the top (left to right):
- Card 1 label: “News” (card contains visible English “BREAKING NEWS”)
- Card 2 label: “Policy document” (card contains Chinese file title fragments)
- Card 3 label: “Financial report” (card contains “2024 Q1 财报” and bar/column chart)
- Card 4 label: “Plot / Fiction” (card contains Chinese paragraph text)
- Central left panel:
- Title: “Digital sandbox simulating…”
- Visible phrase: “Multi-dimensional modeling · Causal reasoning · Future simulation”
- Panel contains a 3D surface-like chart (terrain/heatmap style) and small chart elements
- Central right panel (small module):
- Title/entry: “Key simulation factors”
- Factors and percentages (five listed percentages visible):
- “Economic environment 76%”
- “Policy orientation 68%”
- “Market sentiment 63%”
- “Public opinion heat 59%”
- “Technology evolution 44%”
- Circular gauge shows: “Confidence 82%” (ring progress with center number “82%”)
- Main lower-central title:
- “Multiple future trajectories”
- Four scenario cards (left to right, color/title/bottom label/percentage):
1. Green card: “Optimistic scenario”
- bottom label shows “Support 82%”
- contains an upward-trending line chart
2. Blue card: “Neutral scenario”
- bottom label shows “Neutral 56%”
- contains a flat/stable line chart
3. Yellow/Orange card: “Pessimistic scenario”
- bottom label shows “Concern 71%”
- contains a downward/fluctuating line chart
4. Purple card: “Black Swan scenario”
- bottom label shows “Attention 88%”
- contains a sudden upward spike in the line chart
- Right-side decision-path area:
- Title: “Decision path suggestions”
- Flow nodes connect to four plan items labeled: “Plan A”, “Plan B”, “Plan C”, “Plan D”
- “Plan A” is emphasized (highlighted by a yellow arrow)
- Bottom banner text and icons:
- Left upload hint: “Upload news / policy / financial / plot”
- Center lightning icon and text: “One-click simulate event trajectory”
- Row of small icons and labels (left to right):
- “Public opinion change”
- “Product reaction”
- “Policy impact”
- “Plot branches”
- Visible UI/visual elements (phenomena, charts, colors):
- Central blue holographic brain model (3D mesh) with beams from the four top cards into the brain and colored cables from the brain down to the four scenario cards (cable colors match scenario card colors).
- Circular base device with glowing rings and interfaces labeled “MiroFish.”
- Left sandbox panel, right key-factor panel, and four scenario cards form a control-console layout.
- Each scenario card has small group icons below (representing groups supporting/neutral/concerned/attentive), colored to match the cards; numbers are not shown.
- Overall theme: dark background with blue highlights, futuristic tech styling.
2. Unreadable or partially visible items
- Full text inside the policy document card is not fully readable; only fragments of Chinese words are visible.
- News card body text is not readable; only “BREAKING NEWS” is clear.
- Financial report card’s bar chart numeric values, axis labels and table text are unreadable; only the chart shape and “2024 Q1 财报” are visible.
- Plot/fiction card paragraphs are too small to read word-for-word.
- Specific numeric values, axis labels and time ticks in the four scenario line charts are unreadable (only trend shapes visible).
- Exact counts of the small person icons under each scenario card are unclear.
- Small icons and micro-text on the device base and surrounding panels are too small or blurred to read.
- Some annotations or secondary labels inside scenario cards are partially obscured by lighting effects.
3. Inferences (layout-based reasonable explanations — not directly visible evidence)
- “Confidence 82%” likely indicates the engine’s overall confidence for the current simulation results (inference).
- The four top cards (news / policy / financial / plot) are likely uploadable input sources that feed the central sandbox (inferred from the “Upload …” text and the connecting beams).
- The four scenarios (optimistic/neutral/pessimistic/black swan) represent different model output branches (inferred from the “Multiple future trajectories” title and card layout).
- The “Decision path suggestions” and “Plan A–D” likely represent suggested responses for decision-makers; the highlighted “Plan A” may be the recommended option (inference).
- The base device, holographic brain and beams visualize a data → model → multi-scenario output pipeline (inference).
- The percentage labels under each scenario likely indicate public opinion distributions or model-scored likelihoods, but the image does not explicitly define their meaning (inference).
4. Interface steps (visible or strongly implied by the layout)
- Visible/indicated steps:
1. Upload content (“Upload news / policy / financial / plot”) — visible in bottom banner (fact).
2. Digital sandbox simulation (“Digital sandbox simulating…”) — visible panel text (fact).
3. Generate multiple future trajectories (four scenario cards connected by colored cables) — visible (fact).
4. Inspect key factors and confidence (right panel lists factors and shows “Confidence 82%”) — visible (fact).
5. Review decision-path suggestions and choose a plan (“Decision path suggestions”, Plan A–D) — visible (fact).
- Note: these are the steps presented by the UI mockup; whether they reflect the full product workflow should be confirmed with the project docs (inference).
5. Supplement
- If needed, I can export a line-by-line readable-text list for specific panels (e.g., “Key simulation factors” or the four scenario cards), but some areas may remain unreadable even at higher zoom and will be annotated as such.
SkillPI Creation Analysis
Purpose: The image and summary present MiroFish as an open-source multi-agent digital-sandbox simulation engine that ingests inputs (news, policy documents, financial reports, fiction) and outputs multiple future scenarios plus decision-path suggestions. Intended uses include public-opinion modelling, policy impact analysis, product launch scenario planning, or branching story simulation.
Image evidence highlights: The visual UI shows MiroFish branding, uploadable input categories, a digital-sandbox visualization (3D surface), a right-hand panel listing key simulation factors with percentages, a displayed confidence gauge (82%), four scenario cards (Optimistic / Neutral / Pessimistic / Black Swan) with per-scenario labels, and a decision-path area with Plans A–D. These UI elements are directly visible in the image and indicate the intended input→simulation→scenario workflow.
Related skills and practical steps (inferred, to attempt use):
1) Acquire the project: clone or download the MiroFish repository and read its README and docs to learn exact dependencies and startup steps.
2) Provision environment: set up required runtime (e.g., Python/Node, containers, front-end build tools) and install dependencies—confirm exact versions in the repo.
3) Prepare inputs: collect or format example inputs (news articles, policy texts, financial reports, narrative text) according to repository input specification.
4) Launch the engine and run a simulation: start backend services and the front-end (if included), upload inputs and trigger the sandbox run to produce scenario outputs.
5) Analyze outputs: examine the key-factor panel, confidence metric, scenario cards and recommended decision paths to inform analysis or next actions.
Prerequisites and items to verify before attempting reproduction:
- Confirm runtime requirements and dependency versions in MiroFish documentation (e.g., language runtime, package managers, container images).
- Verify whether the project relies on external LLMs or other model services (if so, obtain API keys, model names, and note usage costs); the image does not confirm backend model details.
- Check how “confidence” and percentage metrics are calculated (the UI shows values but not the method).
- Confirm front-end interactivity: whether a GUI like the image is available out-of-the-box or if the graphic is a mockup.
- Verify input data formats, preprocessing rules and privacy considerations for any real data.
- Review the project license and commercial/redistribution restrictions.
Caveats: The above steps are based on the image and summary; the image itself does not provide code-level or implementation details. Do not assume specific model names, API usage, or precise algorithms without consulting the MiroFish repository and documentation. The image’s numeric labels (e.g., confidence 82%) are UI placeholders; their exact meaning and calculation method must be confirmed in the source code or docs.