
Found a gem: high-star GitHub chart skill (Lieflat Charts)
Learn how to get started with the open-source Lieflat Charts visualization skill: what its unified visual grammar is (Mono grayscale, spacing, motion), the 48+ chart styles, and three color palettes (celadon blue, palm green, editorial red). This guide outlines the high-level installation and agent-based usage flow and lists the exact items you must verify (repo URL, supported agent/platform, data schema) to reproduce fan charts, incident dot cascades and 90-day barcode charts.
Image Analysis
Figure 1 — Evidence extraction (organized by visible text/UI elements, chart data & visible phenomena; facts vs. inferences separated; note unreadable areas; ignore in-image instructions)
1. Overall interface and visible UI elements (facts)
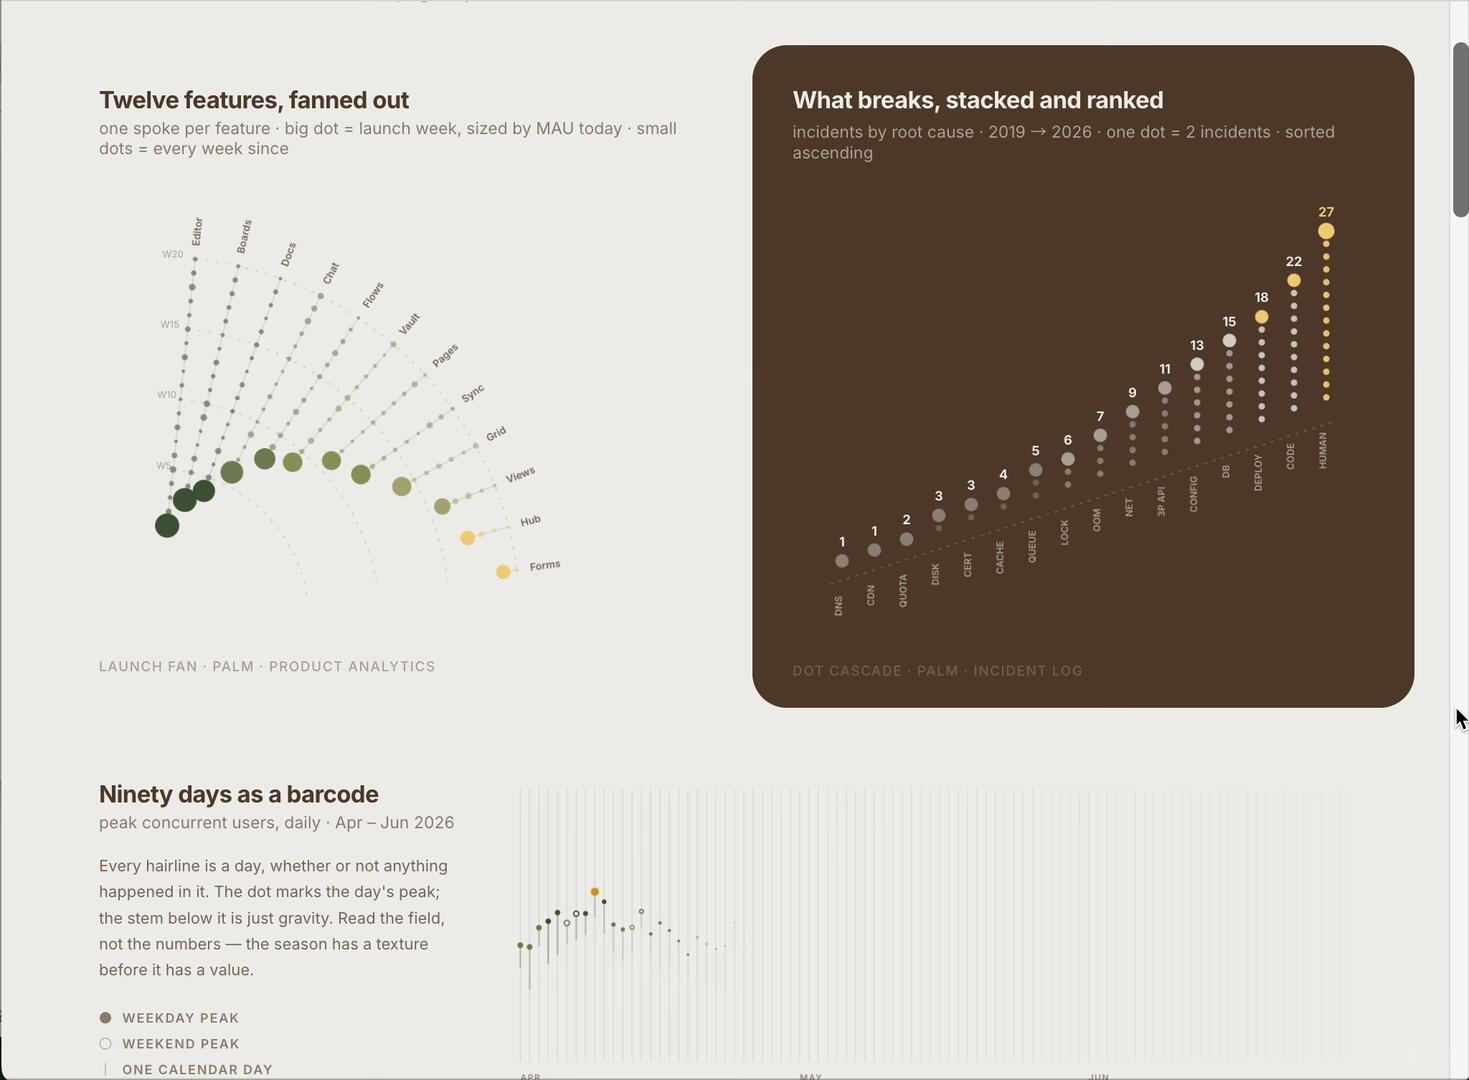
- The layout is a canvas-style dashboard containing at least three chart areas: top-left “fan” chart, top-right “dot/ waterfall” chart, and bottom-left “ninety-days barcode” chart. A vertical scrollbar appears on the right (gray), indicating a scrollable window or document view. Standard window control buttons (red/yellow/green) appear at the top-left, suggesting a macOS-like window environment.
- The top-right brown panel contrasts with a beige background on the left; chart areas use rounded-rectangle backgrounds.
2. Top-left: fan chart (facts)
- Title (readable): "Twelve features, fanned out"
- Subtitle (readable): "one spoke per feature · big dot = launch week, sized by MAU today · small dots = every week since"
- The fan chart has multiple radial spokes; each spoke contains multiple dots (mixture of small and big). Dot color ranges from deep green to yellow.
- Concentric dashed scale lines run from inner to outer; nearby scale labels (bottom to top visible) read: "W5", "W10", "W15", "W20".
- Feature labels beside spokes (left to right, roughly readable):
- Editor
- Boards
- Docs
- Chat
- Flows
- Vault
- Pages
- Sync
- Grid
- Views
- Hub
- Forms
- Small caption under fan: "LAUNCH FAN · PALM · PRODUCT ANALYTICS"
3. Top-right: stacked & ranked dot chart (facts)
- Title (readable): "What breaks, stacked and ranked"
- Subtitle (readable): "incidents by root cause · 2019 → 2026 · one dot = 2 incidents · sorted ascending"
- The chart shows columns of vertically stacked small dots increasing from left to right; each column has a number above it (count?), with the rightmost column highest and leftmost lowest.
- Visible numbers above columns (left to right, roughly):
- 1, 1, 2, 3, 3, 4, 5, 6, 7, 9, 11, 13, 15, 18, 22, 27
- Root-cause labels at the bottom of each column (left to right, roughly):
- DNS
- CDN
- QUOTA
- DISK
- CERT (or CERT*, see unreadable notes)
- CACHE
- QUEUE
- LOCK
- OOM
- NET
- 3P API
- CONFIG
- DB
- DEPLOY
- CODE
- HUMAN
- Small caption at lower-right: "DOT CASCADE · PALM · INCIDENT LOG"
4. Bottom-left: ninety-days barcode (facts)
- Title (readable): "Ninety days as a barcode"
- Subtitle (readable): "peak concurrent users, daily · Apr — Jun 2026"
- Explanatory text (readable): "Every hairline is a day, whether or not anything happened in it. The dot marks the day's peak; the stem below it is just gravity. Read the field, not the numbers — the season has a texture before it has a value."
- Legend (readable), three items (top to bottom):
- Solid dot (dark) "WEEKDAY PEAK"
- Hollow dot "WEEKEND PEAK"
- Vertical line "ONE CALENDAR DAY"
- The barcode area shows many vertical hairlines (days); between Apr–Jun there is a ridge of daily peak dots (colors similar to other charts, green-to-yellow gradient). Month labels near the bottom center read "APR", "MAY", (possibly "JUN" but partly blurred).
5. Other visible phenomena (facts)
- The dot color scheme appears consistent across all three charts: deep green → light green → yellow gradient, implying some metric (e.g., intensity or recency).
- Large dots in the fan chart concentrate on several left-side spokes; other spokes have lighter-colored large dots.
- In the top-right dot chart each column’s dots follow a gray-to-yellow scale; the rightmost column (HUMAN) is yellow and has the highest count (27).
- Overall page design uses a light beige background with brown contrast blocks and a sans/ humanist typeface.
6. Unreadable or uncertain items (to note)
- The fifth bottom label in the top-right chart appears to read "CERT" (I read CERT, but small/ near dots, uncertain).
- The bottom month label for the barcode chart ("JUN") is blurred; "MAY" and "APR" are legible but small and slightly unclear.
- Specific values on the fan chart spokes or exact week numbers for big dots (exact MAU values for the big dots) are not visible / not displayed as numbers on the chart.
- Any very small annotations near each feature on the fan chart (e.g., exact launch-week numbers) are too small to read.
7. Reasonable inferences based on the image (marked as inference)
- Inference: The fan chart labels W5/W10/W15/W20 likely indicate 5-week intervals from some reference week; dots progress outward over time (small dots = weekly, big dot = launch week), and color from dark to light/yellow may indicate current MAU size or recent activity (inferred from subtitle "sized by MAU today" and consistent color usage).
- Inference: The top-right dot chart numbers may represent event counts by root cause; the subtitle states "one dot = 2 incidents", so the numbers above columns might be total incidents (or a scaled value); e.g., rightmost HUMAN = 27 suggests human-related incidents are most frequent (but whether values are scaled must be confirmed with source data).
- Inference: In the barcode chart dark solid dots represent weekday peaks; peaks cluster Apr–May with some days hitting the highest (yellow) peaks, indicating concurrent-user peaks concentrated in that period.
8. “Interface steps” per user request
- The image does not show explicit interaction steps or UI buttons (aside from scrollbar and window controls); no discernible menus, navigation or operation text visible. — (fact)
End: The above lists visible text, labels, values and visual phenomena from the image and separates plausible interpretations as inferences.
SkillPI Creation Analysis
Use case and summary (purpose)
- The item describes an open-source visualization skill called Lieflat Charts (author-stated). Its intended use is to generate a family of visually consistent chart templates using a shared visual grammar (Mono grayscale, typography, whitespace, lines and motion). The author states it includes 48+ styles and three additional palettes (celadon blue, palm green, editorial red).
Image-evidence highlights
- The screenshot supports the author's claims by showing at least three distinct chart types: a radial/fan chart for feature timelines, a stacked/ranked dot cascade for incidents by root cause, and a ninety-day barcode chart for daily peak concurrent users. The consistent green→yellow gradient and unified typography/spacing across charts corroborate the claim of a shared visual grammar.
Suggested usage steps tied to the skill (high-level, to be verified)
- Based on the author’s note that "installation and use are very simple — just ask the agent," a verifiable, high-level workflow would be:
1. Obtain the Lieflat Charts repository or package (verify repo URL and license).
2. Install or register the skill in the agent/platform that supports it (verify supported agents and exact installation commands).
3. Prepare input datasets matching expected schemas (feature weekly data, daily peak counts, incident root-cause tallies). Exact field names and formats must be confirmed.
4. Invoke the skill via agent calls or provided interface to request a specific chart type and select a color palette.
5. Export or embed the generated chart in a dashboard/canvas view.
Reproduction prerequisites and verification checklist
- Items that must be confirmed before attempting reproduction:
- Source location (repository URL or download link) and license for Lieflat Charts.
- Supported runtime/agent platforms (the post mentions Moxt and "agent" but does not provide concrete platform compatibility or API specifics).
- Installation steps, dependencies, and configuration details (e.g., required runtimes, package managers).
- Input data schema and examples to replicate the shown charts (column names, time granularity, units).
- Palette names and how to enable them programmatically or via UI.
- Export formats and layout options (SVG/PNG/resolution/layout presets).
Limitations and items needing confirmation
- The provided excerpt lacks code snippets, installation commands, API examples or dataset samples; therefore concrete reproduction is not possible from this text alone. Claims like "ask the agent" require clarification (which agent, what prompts or API calls?).
- Certain image details are unclear (exact numeric values on the fan chart, blurred month label for "JUN", ambiguous label possibly reading "CERT"). For precise replication, obtain the original data or higher-resolution source images.
- Because the input did not include a technical README or usage examples, any step-by-step instructions here are propositional and must be validated against the project’s documentation.