
AI Large-Model Based Stock-Picking Intelligent Analysis System — Rapid Local Deployment
Learn the practical steps to prepare market data feeds, compute indicators, integrate AI model inference for stock signals, build a real-time watchlist and sector funds-flow dashboard, and deploy the system locally. The guide highlights dependencies and verification points to check in the project repository before reproducing.
Image Analysis
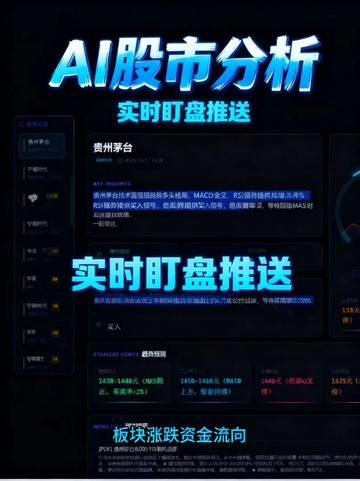
Image 1 — Visual record (organized by visible information)
1. Readable text (facts, only clearly legible content recorded)
- Large centered glowing blue text at top: "AI Stock Analysis"
- Top subtitle (large, glowing blue): "Real-time Watchlist Push"
- Central card top title (white): "Kweichow Moutai" (Guizhou Moutai)
- Mid-image large blue glowing text over the card: "Real-time Watchlist Push"
- Bottom page title (blue): "Sector Rise/Fall Funds Flow"
2. Interface elements and layout (facts)
- Overall style: dark background with glowing blue as primary accent (titles and several modules highlighted in blue/cyan).
- Top contains app name and push notice (see readable text).
- Upper-center has an information card/panel with "Kweichow Moutai" at top-left of the card.
- Below the card is a short paragraph-style text block (not fully legible; see "unreadable content").
- A horizontal colored info bar appears below the card center, containing multiple columns of short text and colored numbers (green/red/white, etc.).
- Left side shows a vertical column of icons and text (sidebar); many labels are blurred/unreadable.
- Right-center has a small chart/frame (with numbers and circular/indicator visuals; details blurred).
- Bottom-most module is titled "Sector Rise/Fall Funds Flow" (title clear; contents partly blurred).
3. Chart data and visible numbers (facts / only clearly visible items recorded)
- In the right-side small module, a numeric fragment "13.3%" is visible (image clarity limited; likely a percentage metric).
- The horizontal info bar under the card shows several colored numeric fragments and range-style text, but most are blurred and not fully identifiable (see "unreadable content").
4. Visible cues and visual hints (facts)
- Red and green are used to indicate up/down (typical market colors): the interface has small red/green numeric blocks.
- Titles and key info use glowing effects (blue/cyan), emphasizing "real-time push" theme.
- Left: navigation/function column; center: main info display; right: auxiliary charts/indicators; bottom: sector funds-flow summary — overall layout matches financial dashboard style.
5. Unreadable / blurred content (facts)
- Most of the paragraph text inside the card is blurred and cannot be fully transcribed (only partial short tokens like "MACD" and "RSI" may be visually suggested but are not legible enough to confirm).
- Sidebar labels on the left are mostly blurred and cannot be identified.
- Specific values and ranges in the horizontal info bar (e.g., price ranges, change %, funds amounts) are mostly blurred or occluded.
- Specific numbers and chart details in the right-side frame are unclear and cannot be accurately described.
6. Inferences (clearly labeled as inferences, not direct evidence)
- Inference: this appears to be a stock/market analysis dashboard providing real-time watchlist and push notifications (based on visible headings "AI Stock Analysis" and "Real-time Watchlist Push" and modules related to price/funds flow).
- Inference: the central card likely represents a stock snapshot or note for "Kweichow Moutai" (based on the card title and layout).
- Inference: the card text may reference common technical indicators (e.g., MACD, RSI, MA), since such abbreviations appear visually ambiguous in the image, but this is not confirmed.
- Inference: the right-side module may show an intra-day change percentage or a real-time metric (based on the visible "%" fragment "13.3%" and typical dashboard placement).
Notes
- The above lists facts visible in the image and clearly labeled inferences for ambiguous parts.
SkillPI Creation Analysis
Purpose and summary:
- The screenshot shows a stock-market dashboard labeled "AI Stock Analysis" with a focus on "Real-time Watchlist Push." Its likely uses include displaying single-stock snapshots, sending real-time alerts, and presenting sector-level funds-flow summaries. This conclusion is based on visible headings and module layout (facts).
Image evidence highlights (facts):
- Top title: "AI Stock Analysis"; subtitle: "Real-time Watchlist Push."
- Central card labeled with the stock name "Kweichow Moutai." Below the card is a horizontal info bar with colored numeric blocks (red/green).
- Bottom module title: "Sector Rise/Fall Funds Flow."
- Right-side small module shows a visible numeric fragment "13.3%" (limited clarity).
Associated skills and recommended steps (specific tools/implementations to be verified):
- Likely technical areas involved (must be verified from the repository or documentation): real-time market data ingestion, time-series feature engineering, technical indicator computation (possible MACD/RSI references in the image), AI large-model inference for signals or commentary, frontend dashboard development, and containerized/local deployment.
Typical implementation workflow (general guidance; not a verified reproduction):
1) Market data: configure and test a real-time data feed (tick/K-line) and historical data API; ensure data permissions and latency are acceptable.
2) Feature/indicator layer: compute technical indicators and derived features (e.g., MACD, RSI, moving averages, funds flow metrics) and align time indices.
3) AI inference: run features through an AI model or inference service to produce selection signals or alert text. The exact model family, weights, or inference API must be confirmed from the source.
4) Dashboard: implement a dark-theme frontend displaying stock cards, real-time metrics, sector funds-flow module, and push/notification mechanisms; ensure components support streaming updates.
5) Local deployment: package backend services and frontend (e.g., with Docker) and configure environment variables, API keys, and monitoring/logging.
Prerequisites and items to verify before attempting reproduction:
- Verify repository README for exact dependencies, model type and weights location, real-time data provider/API, any closed-source or paid components, frontend framework and versions, and provided deployment scripts.
- Clarify blurred elements in the image: whether card text explicitly references MACD/RSI, the semantics of the horizontal info bar (price vs. percentage vs. funds amounts), and the precise meaning of the visible "13.3%."
Limitations and disclaimer:
- This interpretation records visible facts from the image and offers general, commonly used steps for implementing a similar system. It does not verify the original project's code or reproduce its exact functionality. Specific implementation details, models, and data sources must be confirmed from the original repository or author-provided documentation before attempting deployment.